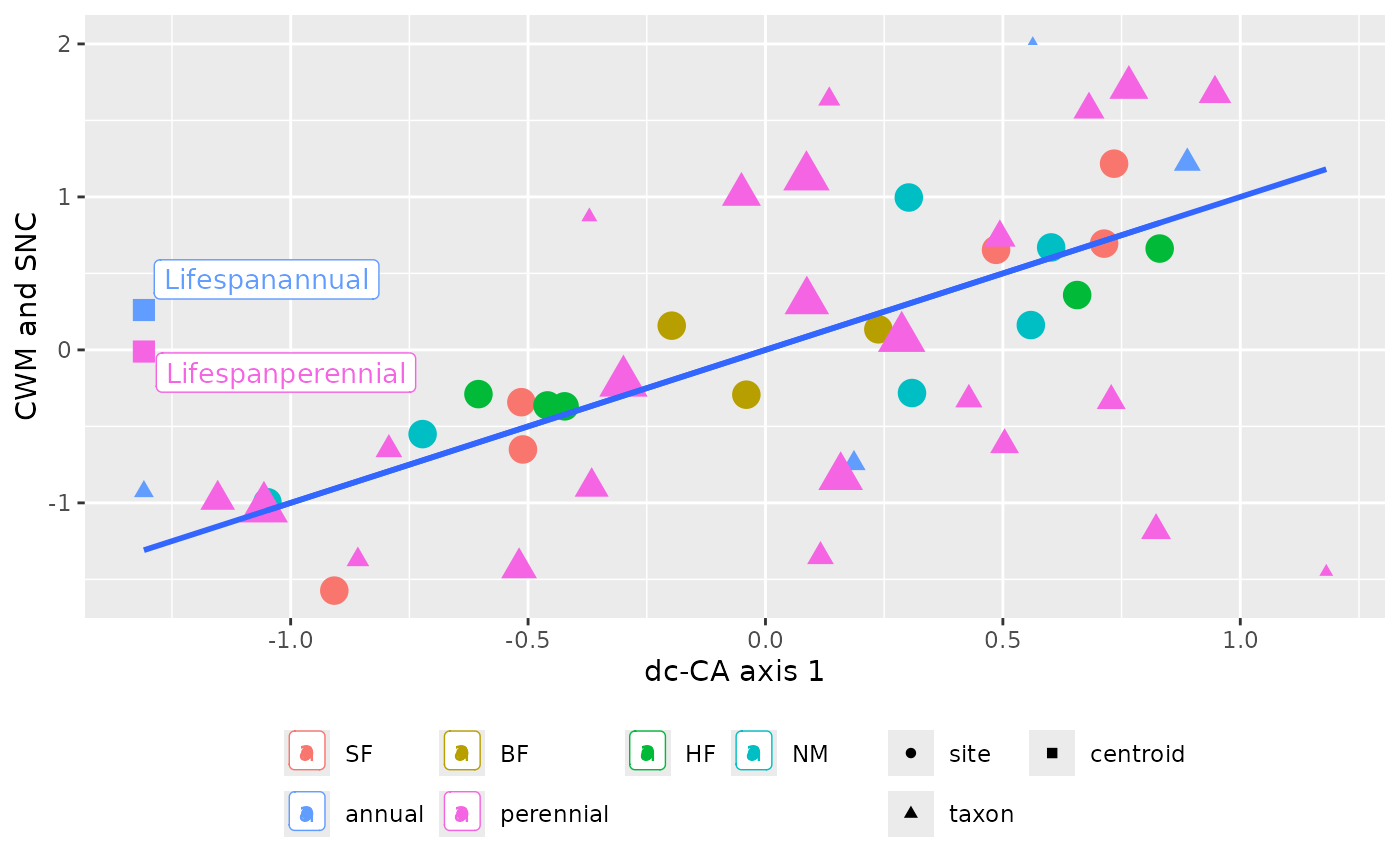
plot_dcCA_CWM_SNC plots the CWMs and SNCs of a dc-CA axis against
this axis, with optional centroids and colors for groups of sites and/or
species if available in the data.
Usage
plot_dcCA_CWM_SNC(
  x,
  axis = 1,
  envfactor = NULL,
  traitfactor = NULL,
  facet = TRUE,
  newnames = NULL,
  remove_centroids = FALSE,
  with_lines = 2,
  formula = y ~ x,
  getPlotdata2plotdCCA = NULL
)
Arguments
- x
results from
dc_CAof classdcca.- axis
the axis number to get (default 1).
- envfactor
name of row factor to display as color and lines in the CWM plot (default
NULL). The default extracts the factor from the environmental model. If set toNA, no additional coloring and lines are displayed inplot.dcca. The parameter sets thegroupsvariable in theCWM_SNCdata frame of the return value/in the plot.- traitfactor
name of column factor to display as color and lines in the SNC plot (default
NULL). The default extracts the factor from the trait model. If set toNA, no additional coloring and lines are displayed inplot.dcca. The parameter sets thegroupsvariable in theCWM_SNCdata frame of the return value/in the plot.- facet
logical. Default
TRUEfor CWMs and SNCs plots in separate panels. This parameter changes the position of the centroid names (from left to right for the environmental centroids). Iffacet = TRUEandwith_lines = TRUE, the line fits ignore groups of species and of sites.- newnames
a list with two elements: names for traits and for environmental variables, default
NULLfor names derived from the result ofscores.dccawithtidy = TRUE.- remove_centroids
logical to remove any centroids from the plot data (default
FALSE). Can be a two-vector, e.g.c(TRUE, FALSE)to remove only the trait centroids.- with_lines
integer values (0,1,2). Default
2for straight lines through groups of points, with confidence intervals around the lines.with_lines=1drops the confidence intervals andwith_lines=0suppresses the lines.- formula
formula to use by ggplot geom_smooth (default y~x).
- getPlotdata2plotdCCA
the results of an
getPlotdata. DefaultNULL.
Details
The argument getPlotdata2plotdCCA is to allow some modifications of
the data frame resulting from getPlotdata. The variable names
and score levels should remain untouched. plot_dcCA_CWM_SNC uses the
variables: dcCAk with axis number k and
"CWM-SNC", "groups", "points", "sizeweight" for the y-axis, coloring,
shape and size of items, respectively.
The current implementation does not distinguish groups of points, if there are two or more factors specified in the model. No lines are plotted if a single factor defines a model.
The function is used in plot.dcca.
Examples
data("dune_trait_env")

# rownames are carried forward in results
rownames(dune_trait_env$comm) <- dune_trait_env$comm$Sites

# must delete "Sites" from response matrix or data frame
Y <- dune_trait_env$comm[, -1] # must delete "Sites"

out <- dc_CA(formulaEnv = ~ A1 + Moist + Use + Manure + Condition(Mag),
             formulaTraits = ~ SLA + Height + LDMC + Seedmass + Lifespan,
             response = Y,
             dataEnv = dune_trait_env$envir,
             dataTraits = dune_trait_env$traits,
             verbose = FALSE)

plot_dcCA_CWM_SNC(out, facet = FALSE)