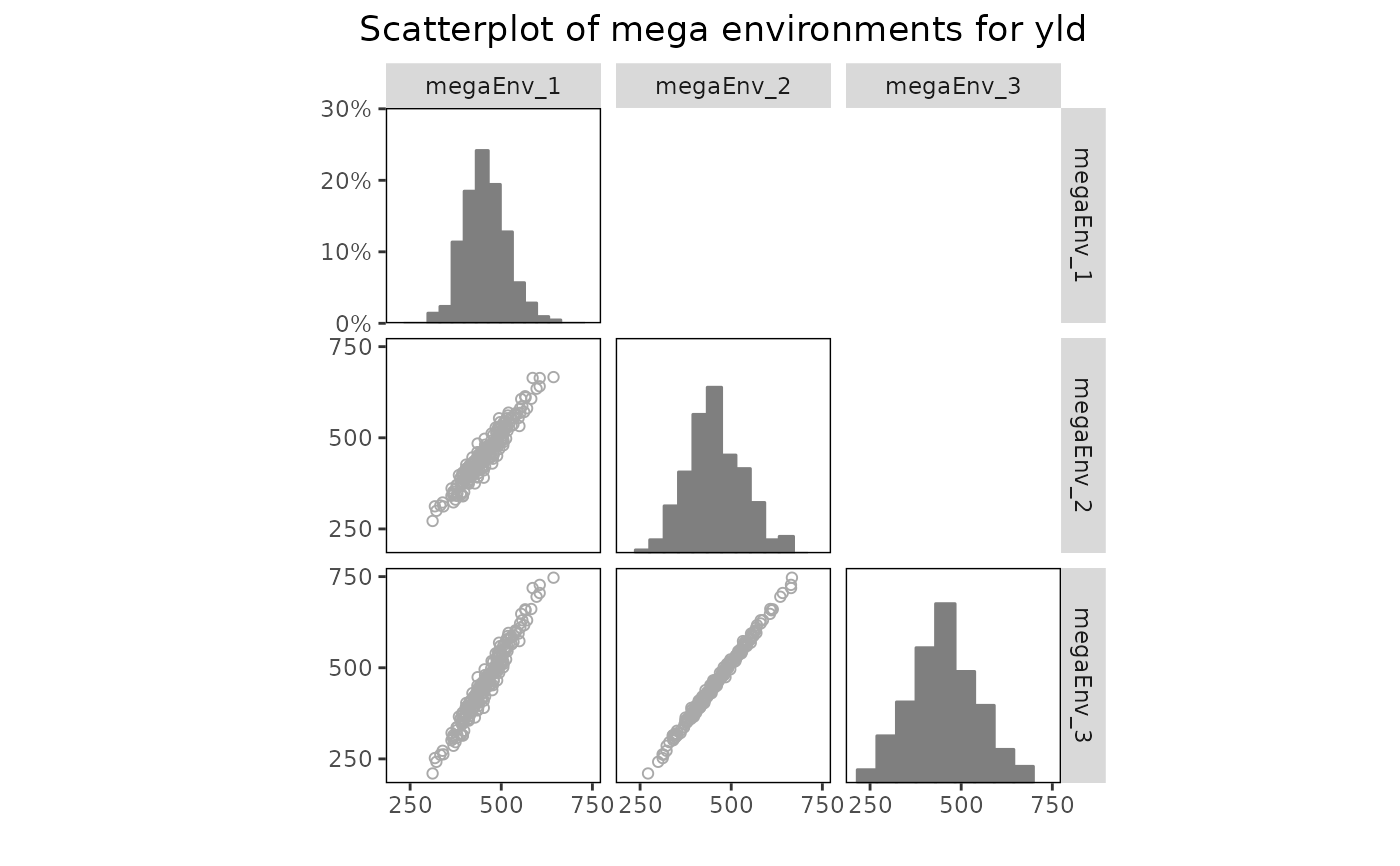
Function for creating scatter plots of predicted values in computed mega environments.
Arguments
- x
An object of class megaEnv.
- ...
Further arguments to be passed on to underlying plot functions.
- engine
A character string specifying the engine used for making the predictions on which the plots are based.
- colorGenoBy
A character string indicating a column in
TDby which the genotypes in the scatter plots are colored. IfNULLall genotypes are displayed in black.- title
A character string used a title for the plot.
- output
Should the plot be output to the current device? If
FALSEonly a ggtable object is invisibly returned.
See also
Other mega environments:
gxeMegaEnv(),
predict.megaEnv()
Examples
## Compute mega environments for TDMaize.
geMegaEnv <- gxeMegaEnv(TD = TDMaize, trait = "yld")

## Create a scatter plot of predicted values.
plot(geMegaEnv)
#> Warning: One should be cautious with the interpretation of predictions for mega environments that are based on less than 10 trials.
#> boundary (singular) fit: see help('isSingular')