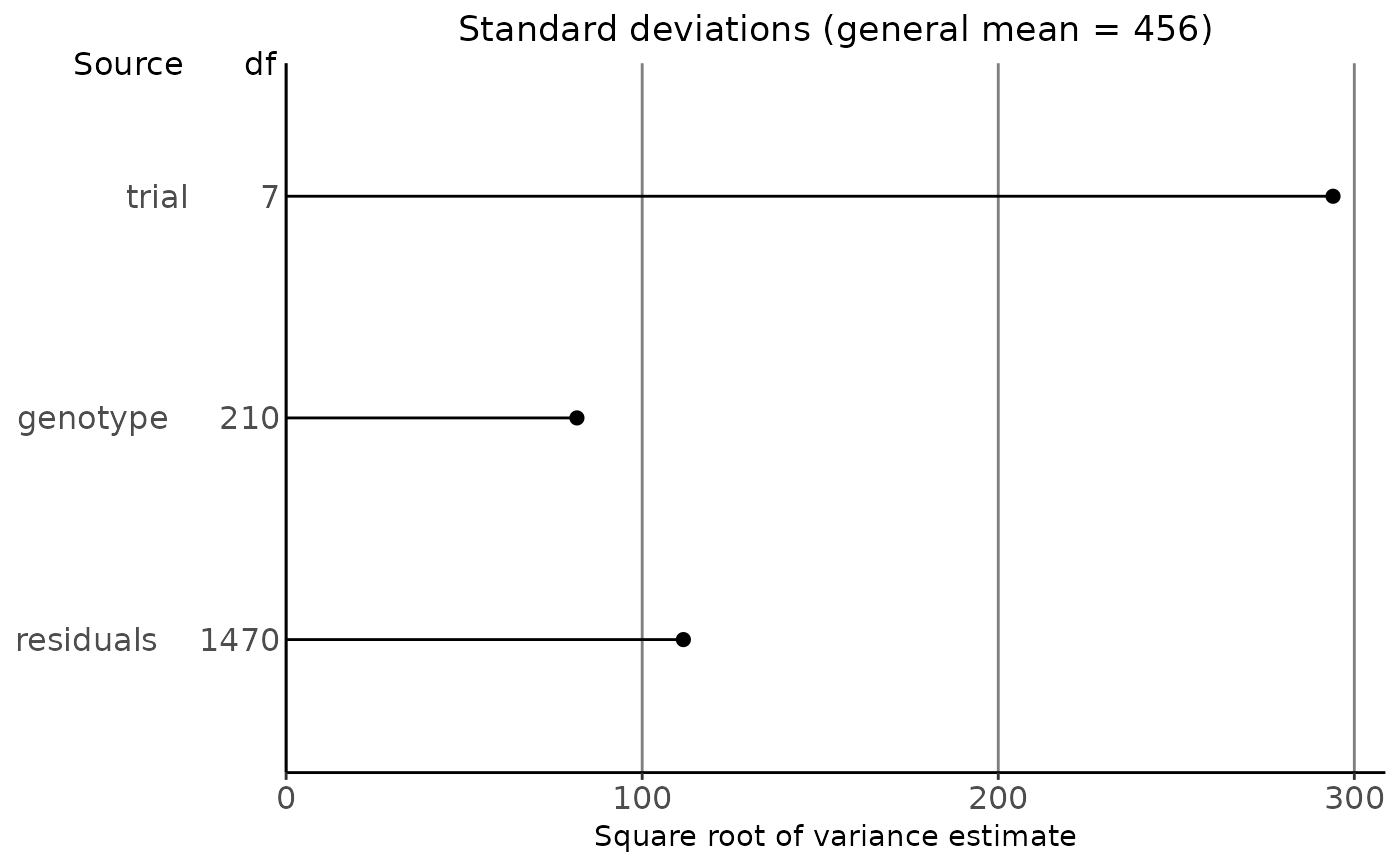
A plot is created of either the standard deviations of each of the terms in the fitted model or the percentage of variance explained by each of the terms in the fitted model. Also the degrees of freedom for each of the terms is shown in the plot.
Arguments
- x
An object of class varComp
- ...
Not used.
- plotType
A character string. Either "sd" to plot the standard deviation of the variance components, or "percVar" to plot the percentage of variance explained by each variance component.
- title
A character string used a title for the plot.
- output
Should the plot be output to the current device? If
FALSEonly a ggplot object is invisibly returned.
See also
Other Mixed model analysis:
CRDR(),
correlations(),
diagnostics(),
gxeVarComp(),
herit(),
predict.varComp(),
vc()
Examples
## Fit a mixed model.
geVarComp <- gxeVarComp(TD = TDMaize, trait = "yld")

## Plot the standard deviations.
plot(geVarComp)

## Plot the percentage of variance explained.
plot(geVarComp, plotType = "percVar")
## Plot the percentage of variance explained.
plot(geVarComp, plotType = "percVar")
