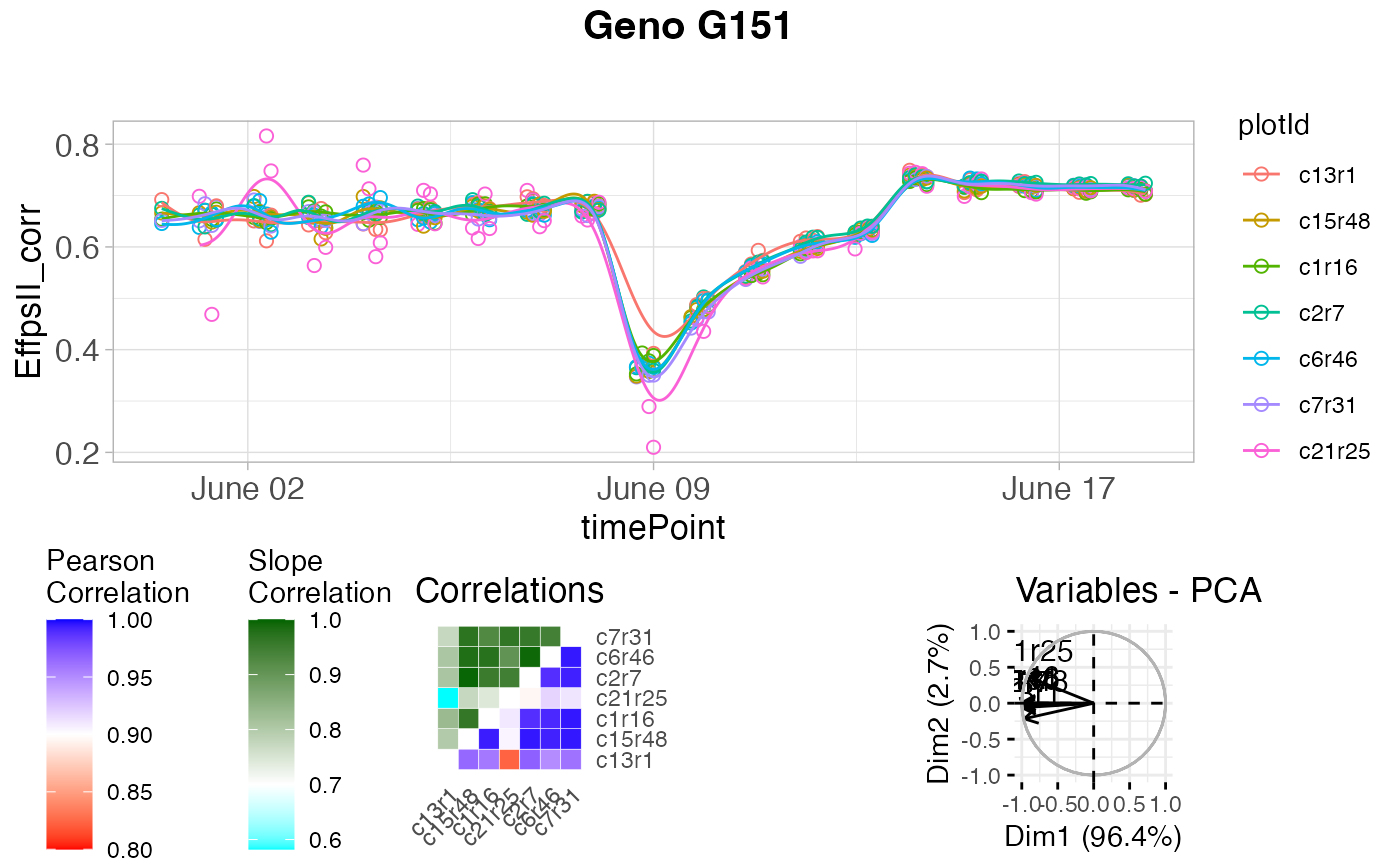
Function for detecting strange time courses. The function uses the estimates
for the spline coefficients per time course (typically per plant).
Correlations between those coefficient vectors are calculated to identify
outlying time courses, i.e., plants. An outlying time course will have low
correlation to the majority of time courses. To support the analysis by
correlations, a principal component analysis is done on the plant
(time course) by spline coefficient matrix. A PCA plot of the plant scores
will show the outlying plants. Finally the pairwise-ratios of the slopes of
a linear model fitted through the spline coefficients are computed. Plants
are tagged when the average pairwise-ratio is lower the a given threshold
(thrSlope).
Usage
detectSerieOut(
  corrDat,
  predDat,
  coefDat,
  trait,
  genotypes = NULL,
  geno.decomp = NULL,
  thrCor = 0.9,
  thrPca = 30,
  thrSlope = 0.7
)
Arguments
- corrDat
A data.frame with corrected spatial data.
- predDat
A data.frame with predicted data from a fitted spline.
- coefDat
A data.frame with coefficients from a fitted spline.
- trait
A character string indicating the trait for which to detect outliers.
- genotypes
A character vector indicating the genotypes for which to detect outliers. If
NULL, outlier detection will be done for all genotypes.- geno.decomp
A character vector indicating the variables to use to group the genotypic variance in the model.
- thrCor
A numerical value used as threshold for determining outliers based on correlation between plots.
- thrPca
A numerical value used as threshold for determining outliers based on angles (in degrees) between PCA scores.
- thrSlope
A numerical value used as threshold for determining outliers based on slopes.
See also
Other functions for detecting outliers for series of observations:
plot.serieOut(),
removeSerieOut()
Examples
# \donttest{
## The data from the Phenovator platform have been corrected for spatial
## trends and outliers for single observations have been removed.

## Fit P-splines on a subset of genotypes
subGenoVator <- c("G160", "G151")
fit.spline <- fitSpline(inDat = spatCorrectedVator,
                        trait = "EffpsII_corr",
                        genotypes = subGenoVator,
                        knots = 50)

## Extract the data.frames with predicted values and P-Spline coefficients.
predDat <- fit.spline$predDat
coefDat <- fit.spline$coefDat

## The coefficients are then used to tag suspect time courses.
outVator <- detectSerieOut(corrDat = spatCorrectedVator,
                           predDat = predDat,
                           coefDat = coefDat,
                           trait = "EffpsII_corr",
                           genotypes = subGenoVator,
                           thrCor = 0.9,
                           thrPca = 30,
                           thrSlope = 0.7)

## The `outVator` can be visualized for selected genotypes.
plot(outVator, genotypes = "G151")

# }
# }