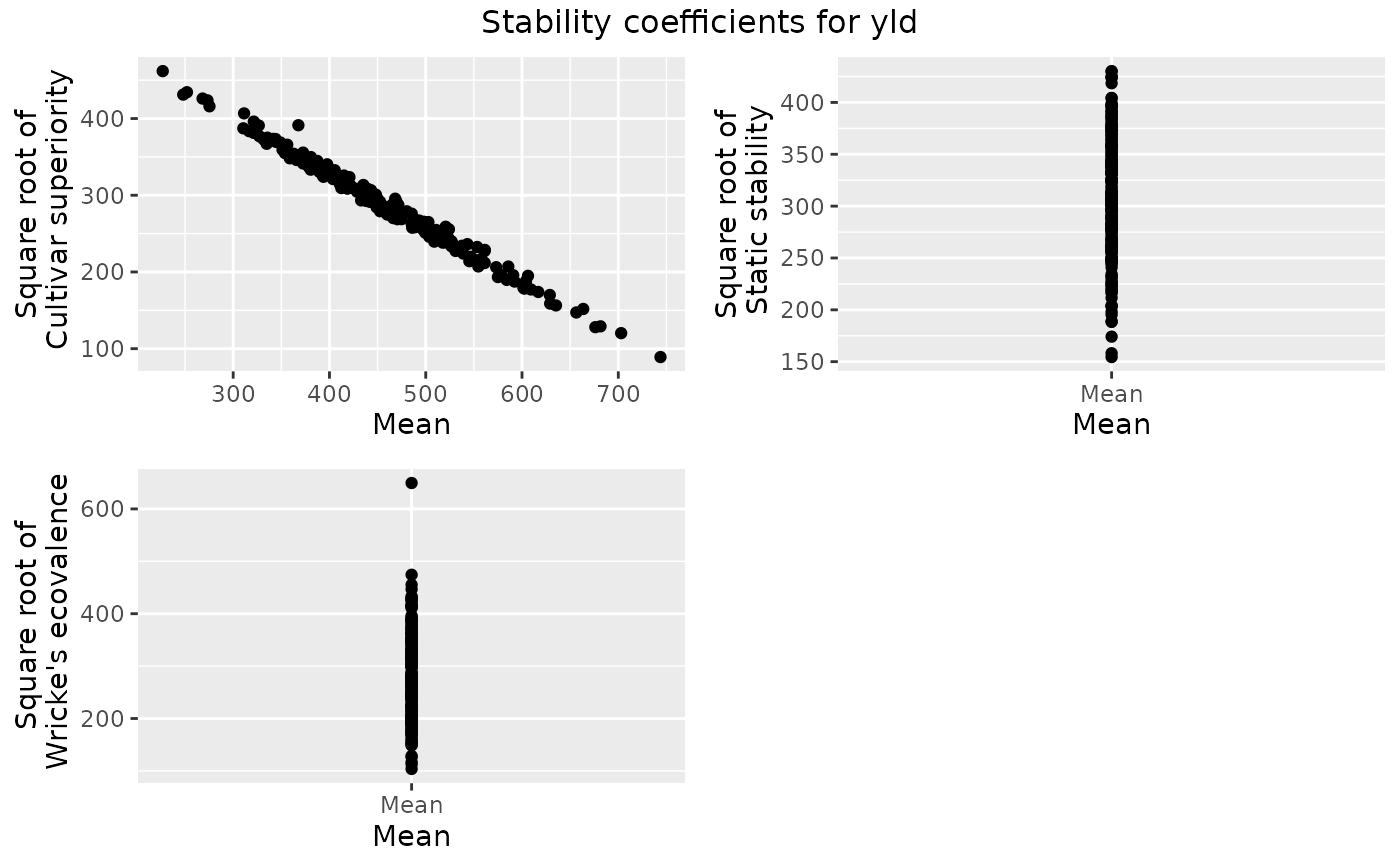
Function for creating scatter plots of the square roots of the computed stability measures against the means.
Arguments
- x
An object of class stability.
- ...
Not used.
- colorGenoBy
A character string indicating a column in the
TDused as input for the stability analysis by which the genotypes should be colored. IfNULLall genotypes will be colored black.- colGeno
A character vector with plot colors for the genotypes. A single color when
colorGenoBy = NULL, a vector of colors otherwise.- title
A character string used a title for the plot.
- output
Should the plot be output to the current device? If
FALSEonly a list of ggplot objects is invisibly returned.
See also
Other stability:
gxeStability(),
report.stability()
Examples
## Compute three stability measures for TDMaize.
geStab <- gxeStability(TD = TDMaize, trait = "yld")

## Create scatter plots of the computed stability measures against the means.
plot(geStab)